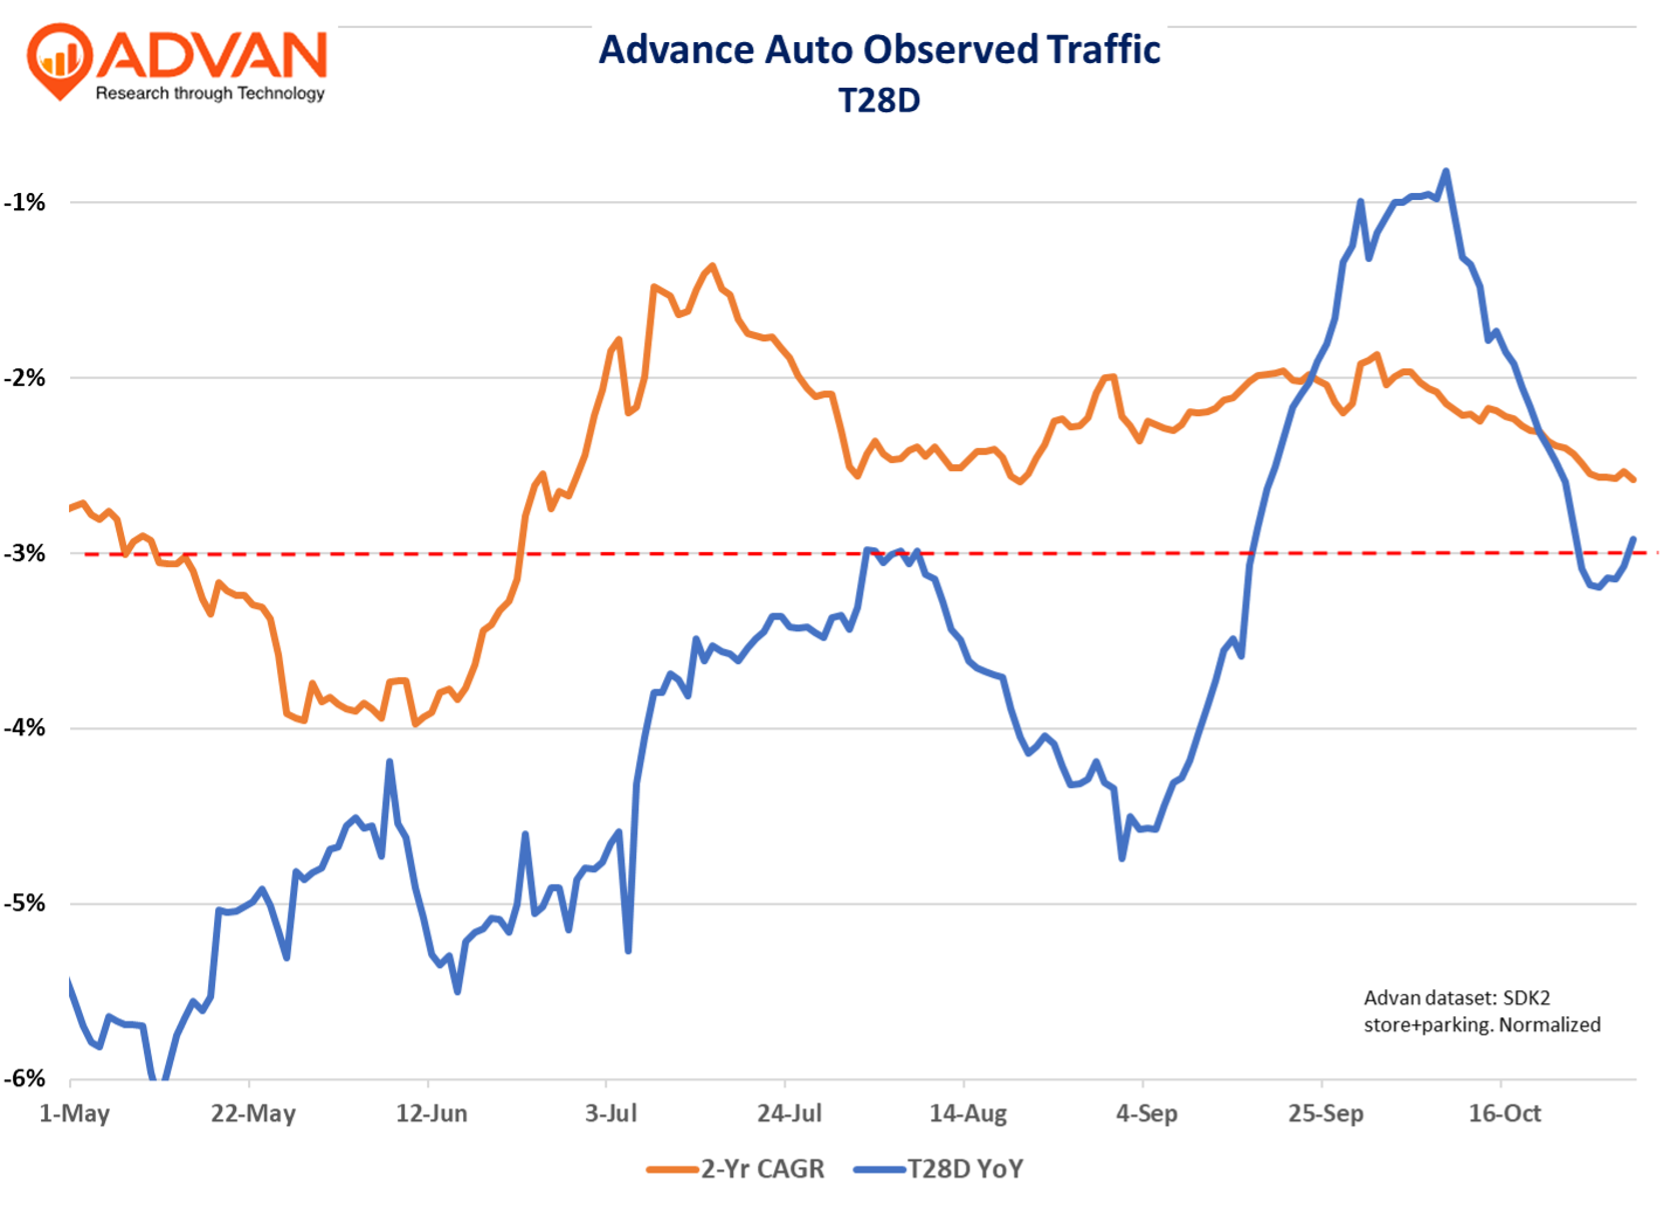
As we saw with the results from O’Reilly and NAPA, Advance Auto Parts also reported stronger comp-sales and gross profits, and especially on the commercial side (also called DIFM or Pro). Overall comp-sales, accelerated by +300bps, with DIY and commercial improving similarly; commercial comps (+4%) outperformed DIY’s +2%, as is the case for the industry. The observed traffic, shown in the chart, is for all observed Advance retail locations; the prior quarter’s business divestitures and store closures will impact the percent-change observed (which we estimate equates to a 250 to 300 bps headwind to our observations). As a consequence, we focus on the QoQ sequential change. On a 1-year basis, observed visits (Advan) improved by +200bps QoQ, and on a 2-year basis by +170bps.
Comp-sales was also bolstered by additional tariff cost pass-through (+100bps) and comp-ticket was positive. However, our transaction data suggests a lot of trade down in the DIY basket. As such, we suspect that the comp improvement was more traffic-driven than inflation / check-driven. That makes intuitive sense as Advance closed 465 underperforming locations in the prior quarter, which made up nearly 10% of the store base. The DIY channel improved sequentially on a 2-year basis (just as we show in the chart).

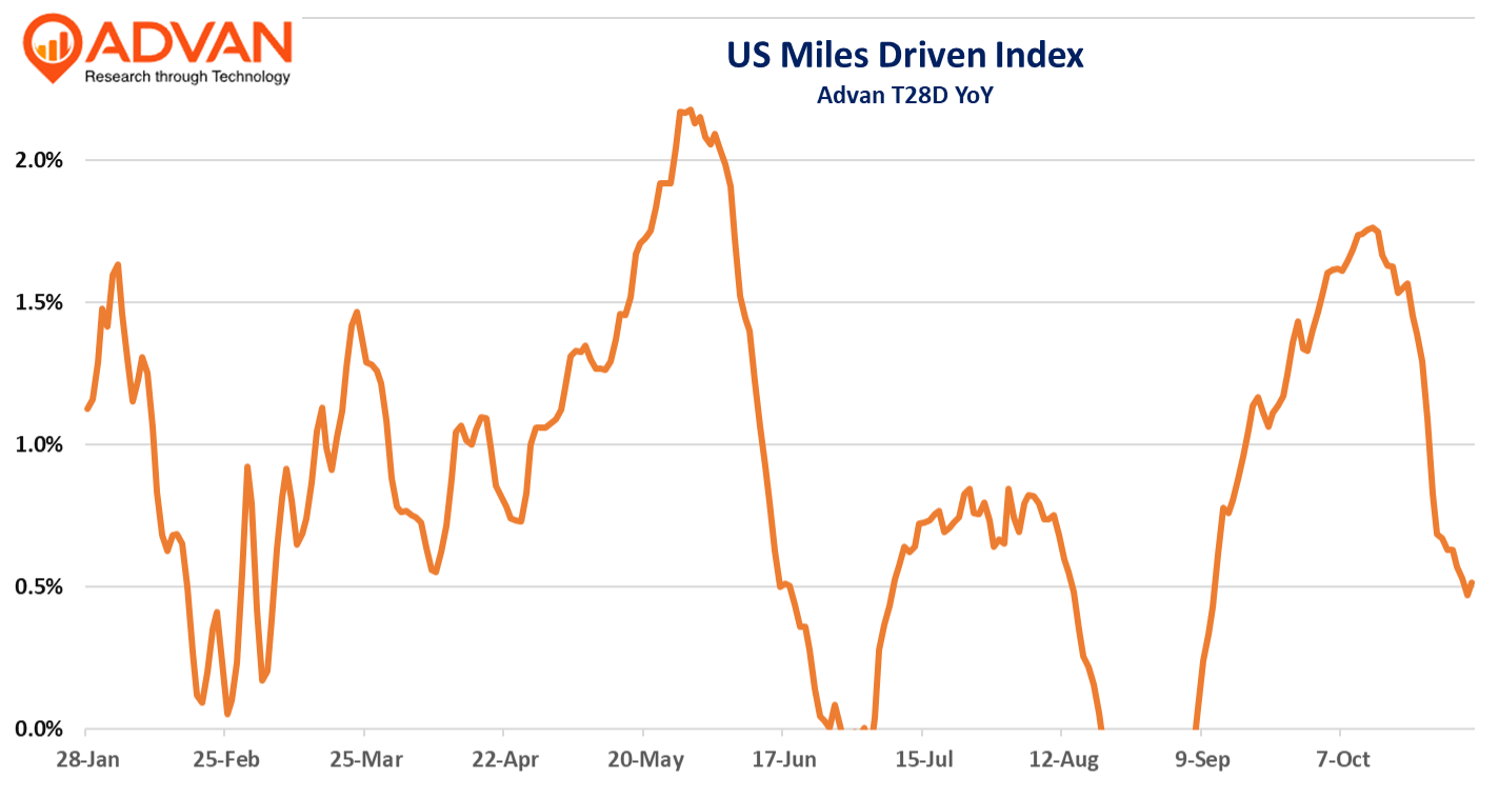
On the quarter-to-date trend, CFO Ryan Grimsland said, “Trends through the first three weeks, which have started off soft, while the Pro channel continues to track positive, the DIY channel is seeing pressure with more week-to-week variability in transactions. We believe this is being driven primarily by adjustments in consumer purchasing habits in response to rising prices.” Thus, similar to what we show above and in our average transaction size data. But wait a minute, how can O’Reilly, NAPA, (and presumably AutoZone) doing better if the typical share doner, Advance, is also doing better? Well for one, the industry is still fragmented with the Big-4 holding only 23% share per Morgan Stanley research. And so, perhaps the 77% are doing worse in aggregate. A more plausible answer in our opinion is that the industry’s drivers are strengthening – (1) an aging PARC (12.8 years is the average age of the vehicle on the road), (2) more miles driven (back to the office), and (3) most still have their jobs (or are working two jobs to afford the cost-of-living inflation) – meaning should their car breakdown, they have the means to fix it.

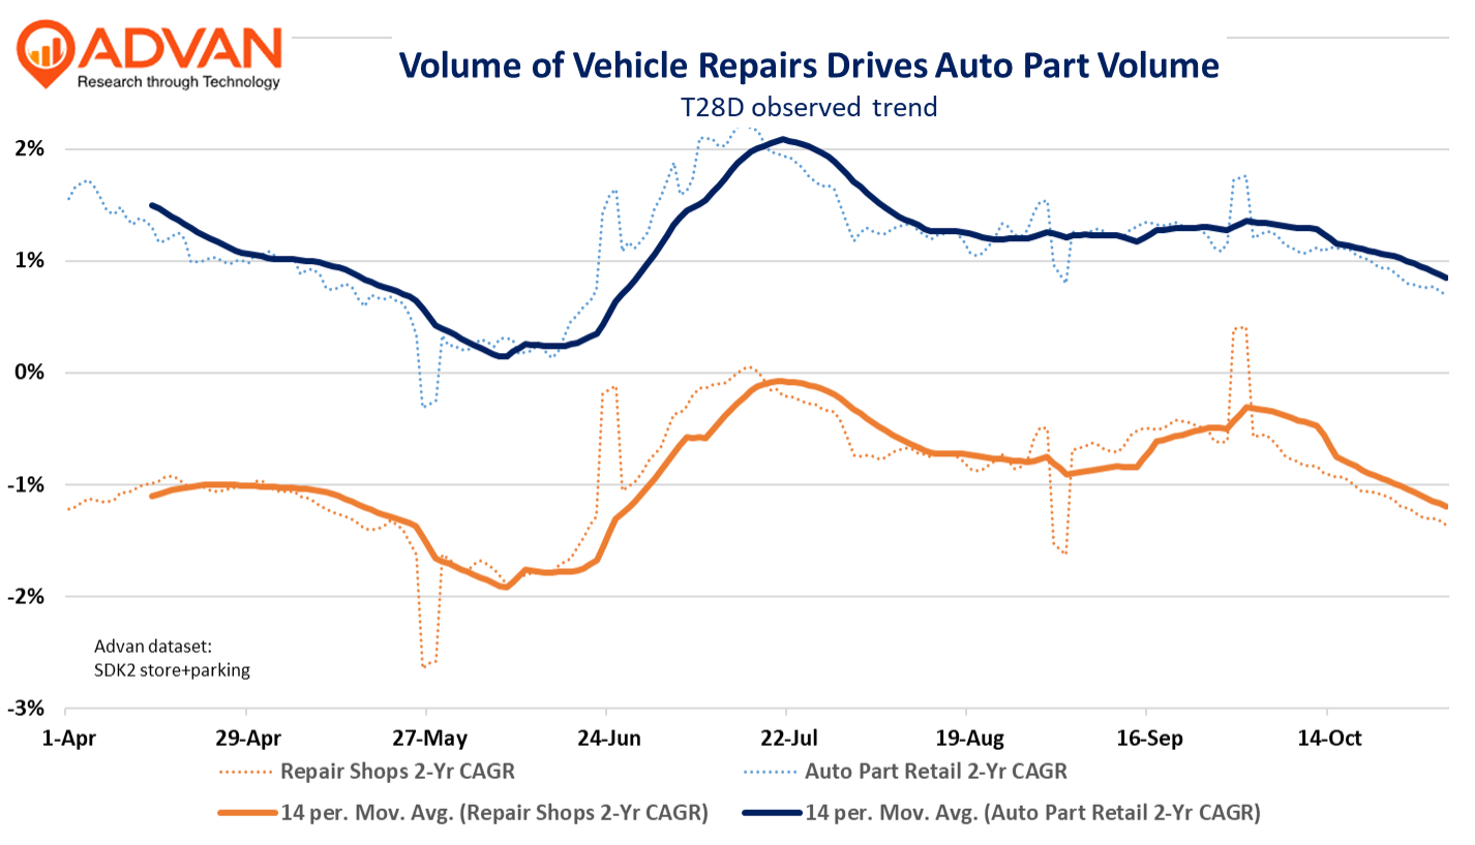
As shown in the chart below, the auto part retail visit trend closely matches the auto repair shop trend. For retail, this is NAICS code #441310 and we capture 22.1K stores in our index. For repair shops, this is NAICS code #811111 and we capture 105.6K shops, i.e. that’s a big sample. Census counts 153K establishments in #811111; thus, we are sampling nearly two-thirds of the population. This makes the case that to monitor the vibrancy of the auto part industry, it’s critical to also monitor the traffic to auto repair shops.


 LOGIN
LOGIN
