 LOGIN
LOGIN

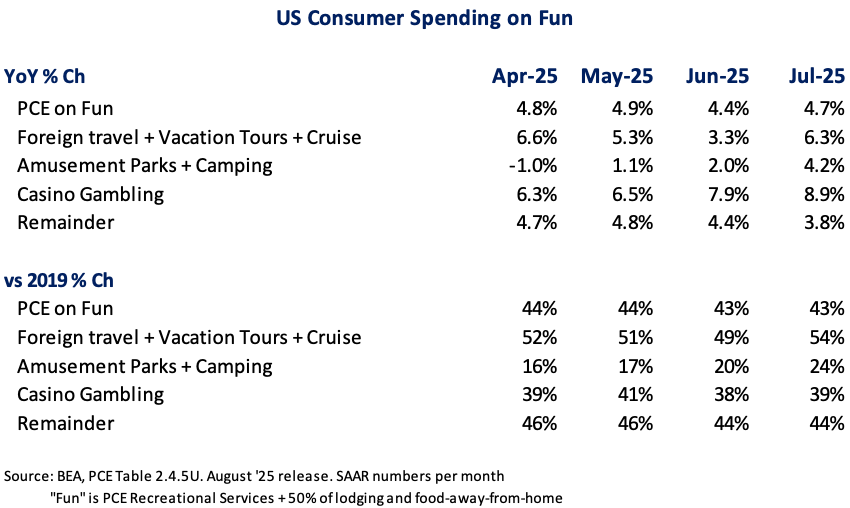
Well for the non-Disney-s and -Universals of theme parks, the season ended on a soft note. Disney’s marketing machine and the new Universal Epic Universe park had just too much of a pull. Separately, given our “thrifty K-shaped consumer-economy” cruise as a better value continues to take market share (third season in a row). The way we track market share is shown in the table. Personal Consumption Expenditures on “Fun” has outpaced Amusement Parks + Camping spending each month of the summer. By contrast, except for June, Foreign Travel + Vacation Tours + Cruise has outpaced Fun. Versus 2019, Foreign Travel + Vacation Tours + Cruise is up over 50%, whereas, Amusement Parks + Camping, only 24%. Note that the level to ’19 for Amusement Parks has grown since May; that’s do to better performance in the Summer of ’21 – a period when the industry boomed as Foreign Travel + Vacation Tours + Cruise were still in the Covid-bunker.
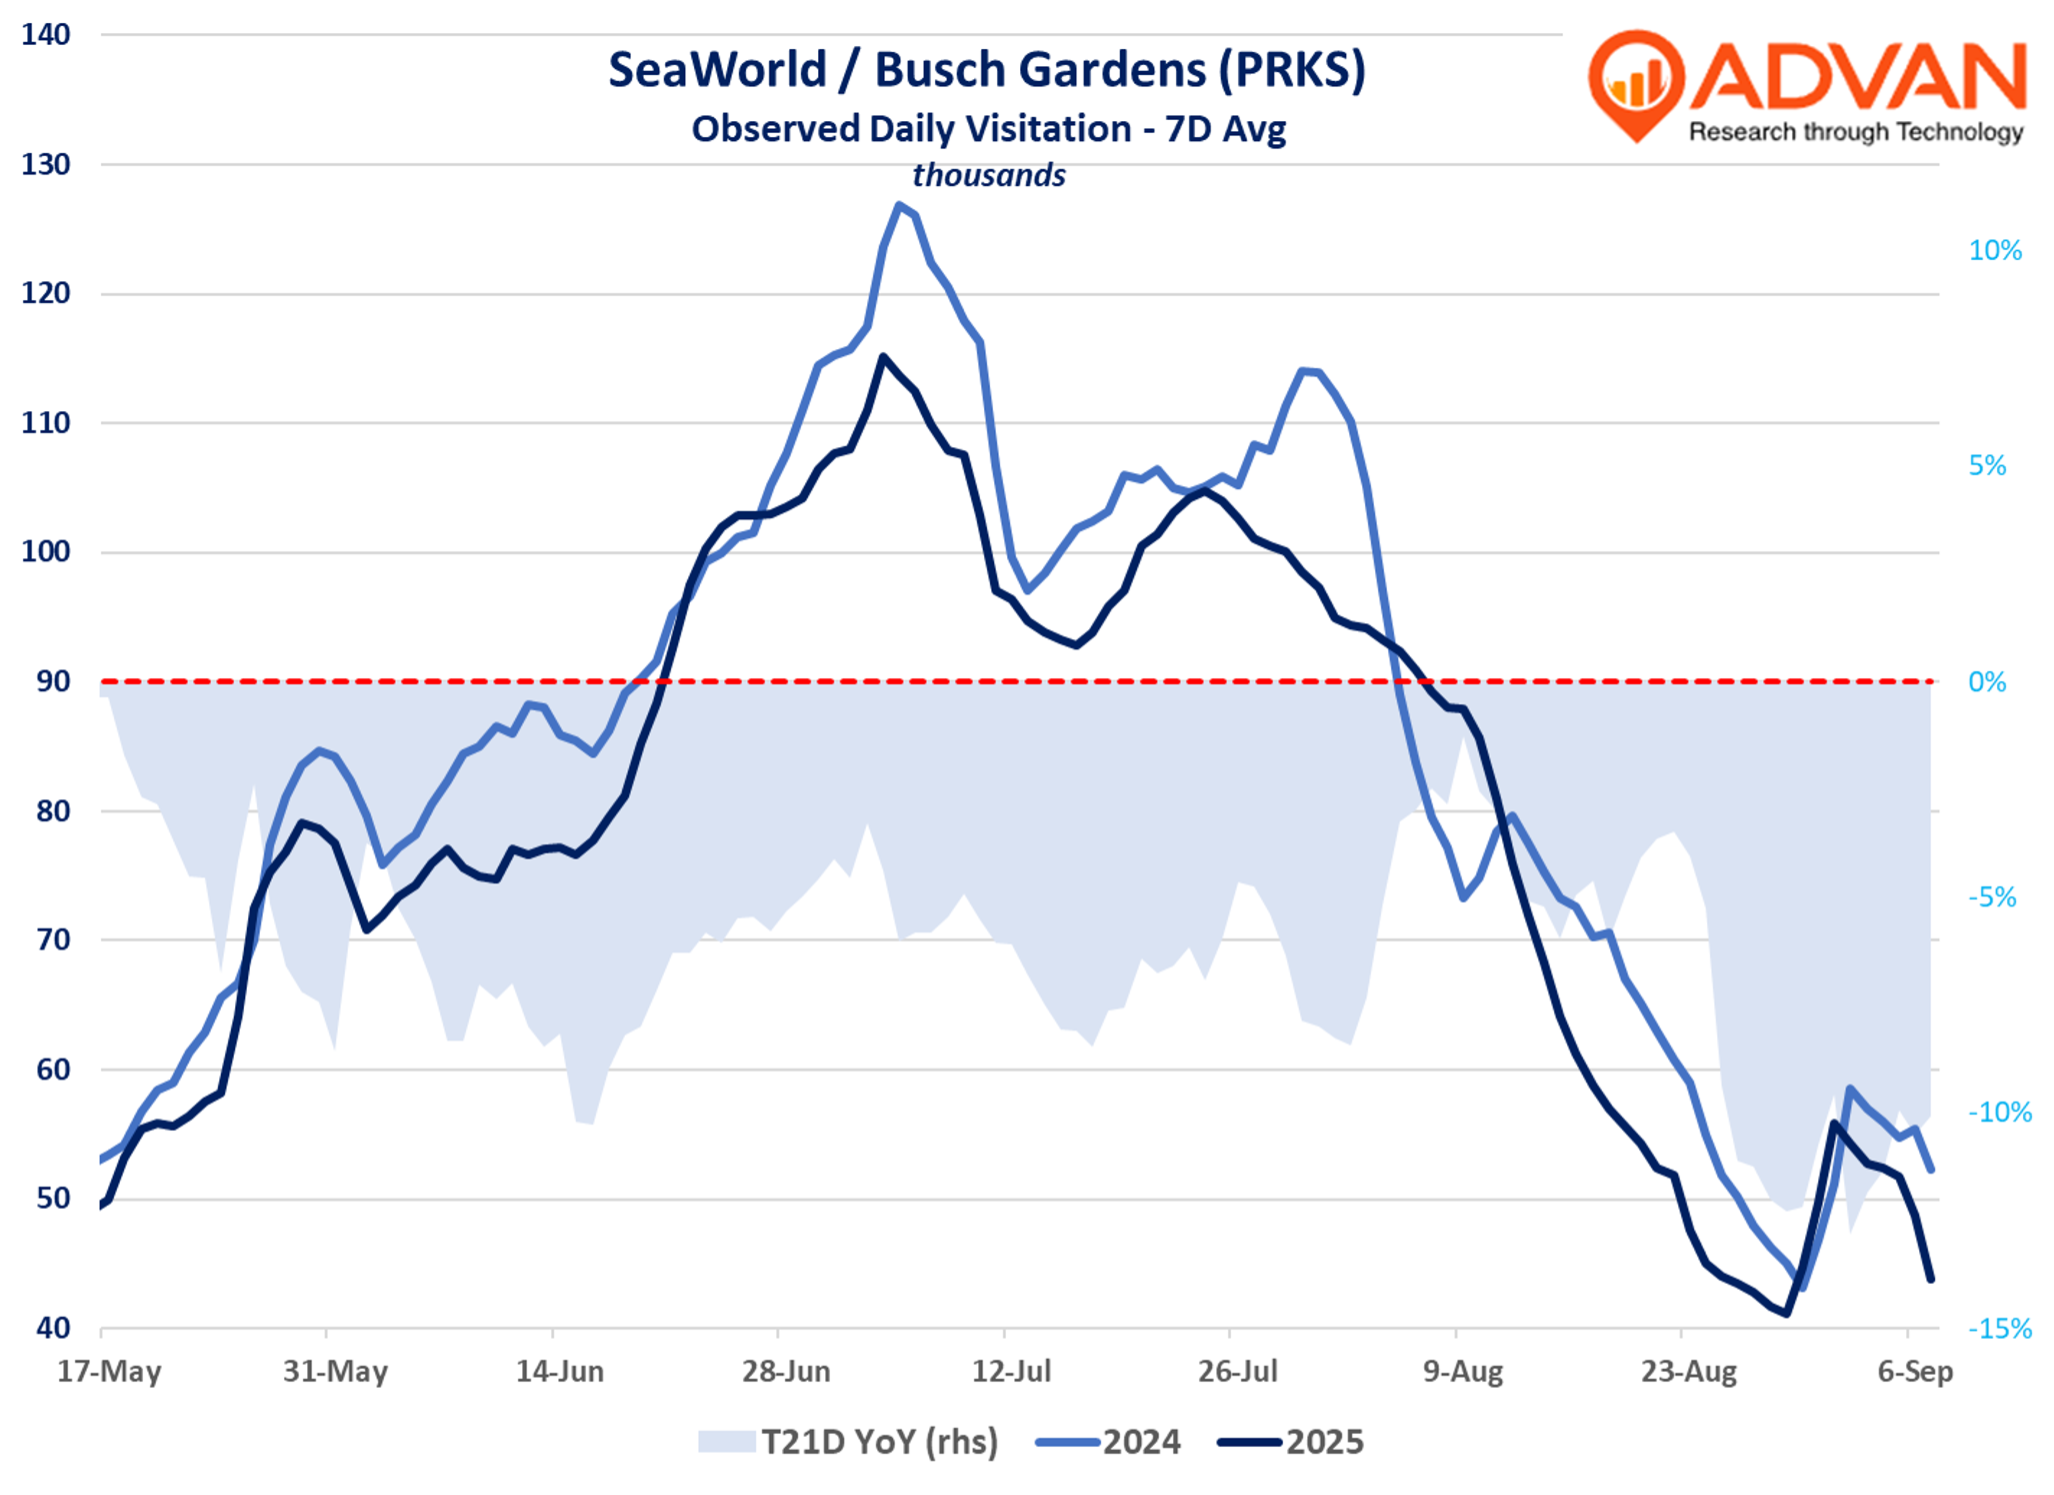
For theme parks, recall that Q2 was marked by challenging weather. For United Parks & Resorts (SeaWorld + Busch Gardens), the trend improved in July and the 1st week of August, before softening again. PRKS’ management sounded encouraged (August 7th earnings call) by the improvement and set expectations for a reasonable result for the full season. That wasn’t to be. The Advan + Maiden Century model is estimating a -1.7% decline in attendance for the Q3 period, but the trend in attendance suggests that it will be below that. Excluding Easter’s timing, Q2 attendance was “flattish,” however, that was promotionally driven as rate decline -4% YoY. We see no reason to not believe that rate will be down similarly in Q3, leading to a total revenue decline of approximately -5-6%, which is worse than Street expectations.
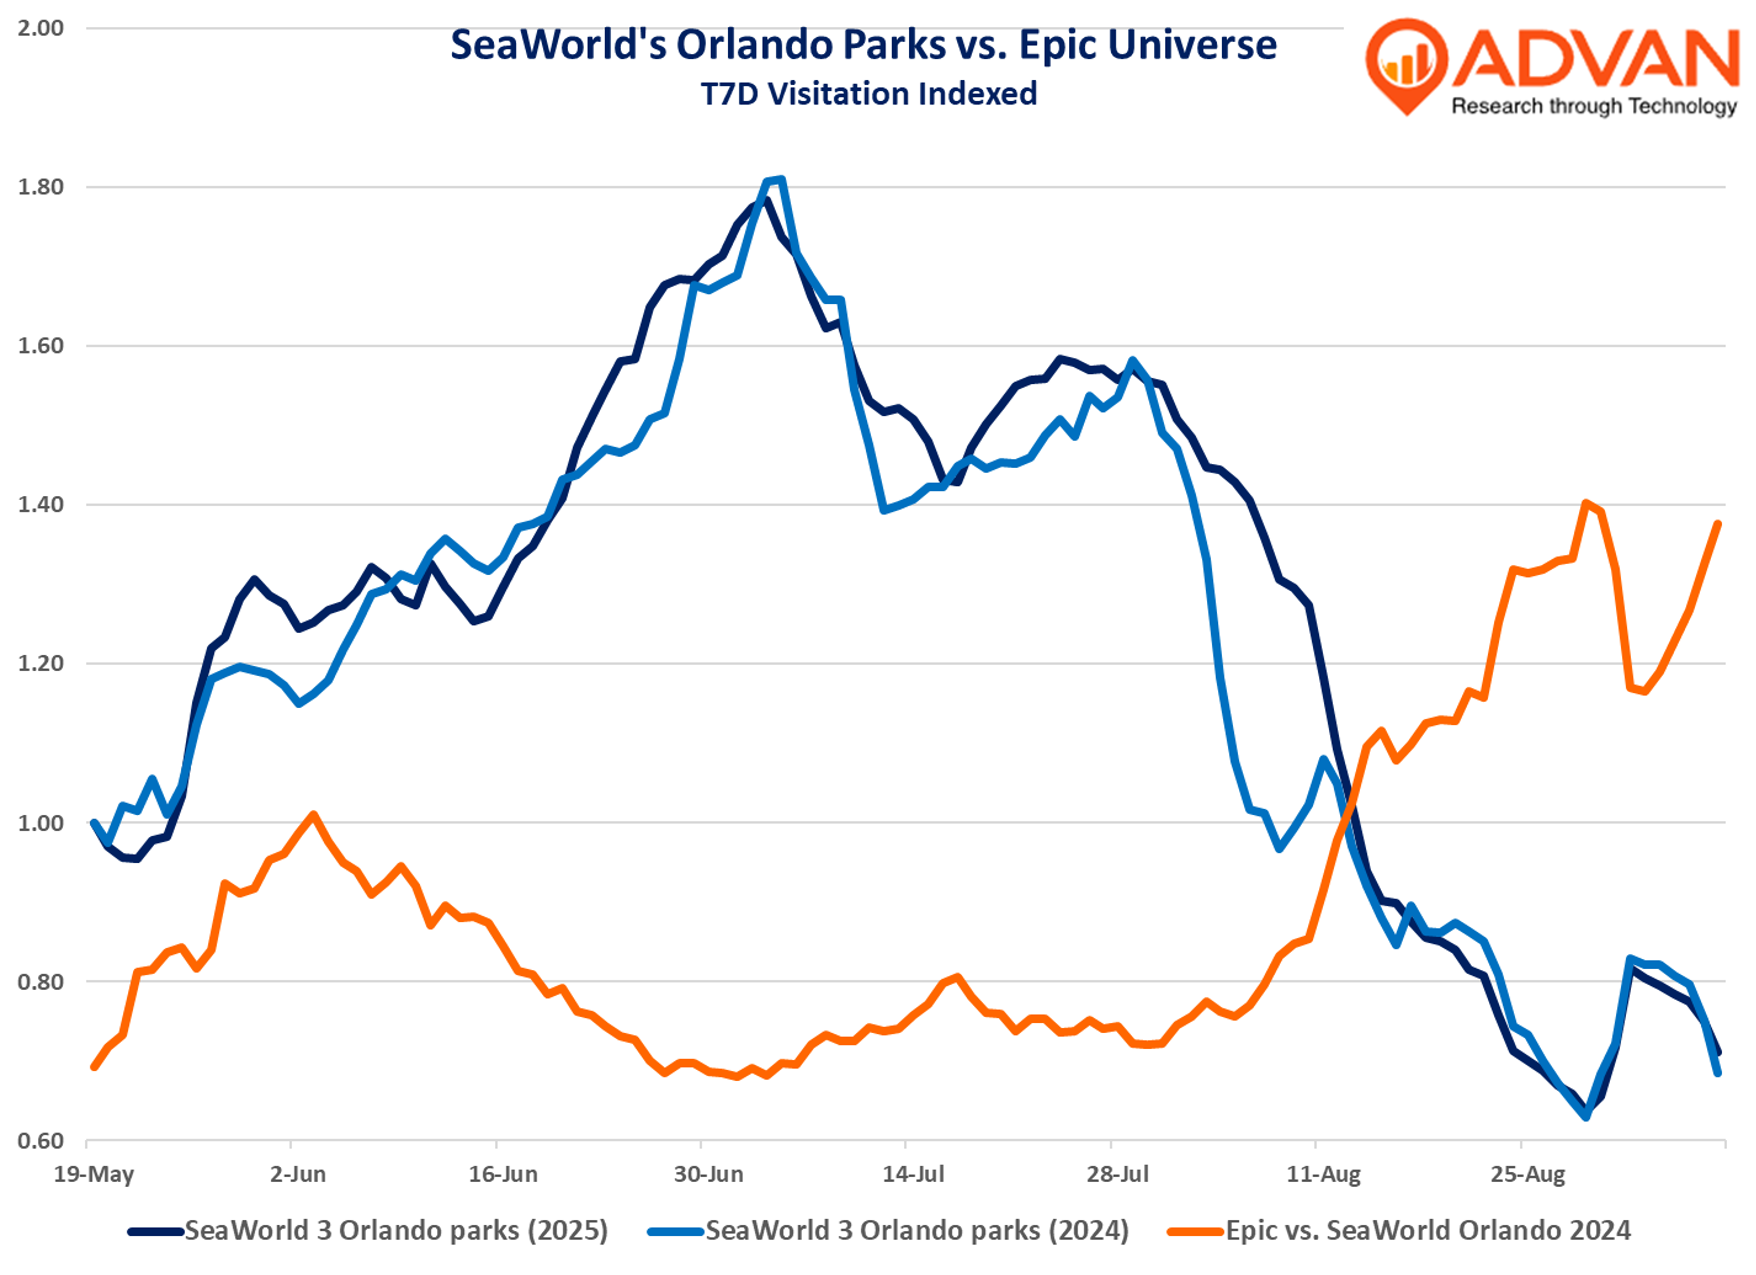
On its Q2 earnings call, United Parks & Resorts (PRKS) CEO Marc Swanson said, “We saw an increase in attendance at all of our Orlando parks, including SeaWorld Orlando, Aquatica Orlando and Discovery Cove… our SeaWorld Orlando Park has been up in attendance since Epic opened on May 22. It was up for the full second quarter, and it was up if you measure from the date Epic opened through the end of the second quarter. It continues to be up quarter-to-date in the third quarter through August 6 on a day-to-day basis, and we expect attendance for the remainder of the year at this park to be up as well.” The following chart confirms that statement, especially early August. (The number of observed visits between May 22nd and August 7th was flattish YoY, but International visitors will have added 100 to 150bps to the growth rate.) Interestingly, Epic’s strong spurt of growth in August and early September coincides with a give in the SeaWorld trio’s outperformance to 2024. We suspect that Epic’s spurt is due to Universal making more tickets available.
Given that Epic Universe will be running at 100% throughout next summer, new attractions at Disney World, and more cruise ship supply coming over the next year (+16 ships vs. +11 in ’15), it will be interesting to see how PRKS can drive growth in 2026.