 LOGIN
LOGIN
Chili’s outstanding market share gains continues with FQ1 comp-traffic gaining +13% which drove a similar gain QoQ in the 3-year comp CAGR (+4.2%). (Brinker’s fiscal quarter ended September 24th.) Price and mix each added 4 pts, taking the comp-sales increase to 21.4%. As a reminder, industry sales growth is only +4% range*, and so, Chili’s is 5X that. FQ1’s strong comps also drove robust increases in margins and earnings, with Chili’s restaurant operating margin hitting 17.3%. Observed traffic (Advan) shows a similar cadence on a 2-year CAGR basis, against last year’s atypical period in September and October (hurricane). That 2-year consistency supports CEO Kevin Hochman’s noted confidence in the press release, “Our consistent investments in food, service, and atmosphere, combined with strong plans, give us confidence we can build on this growth and successfully lap the high sales comparisons in FQ2 & FQ3.” (These periods had comp-sales increases just above 31%; yes, incredible gains.) CFO Mika Ware, “ Chili’s [October comp] sales are in the high single digits, and our expectations are Chili’s same-store sales will normalize on average in the mid-single-digit range for the balance of the fiscal year.” Adding contributions from price and mix to the traffic shown below, gets one to the high single digits, if not above.
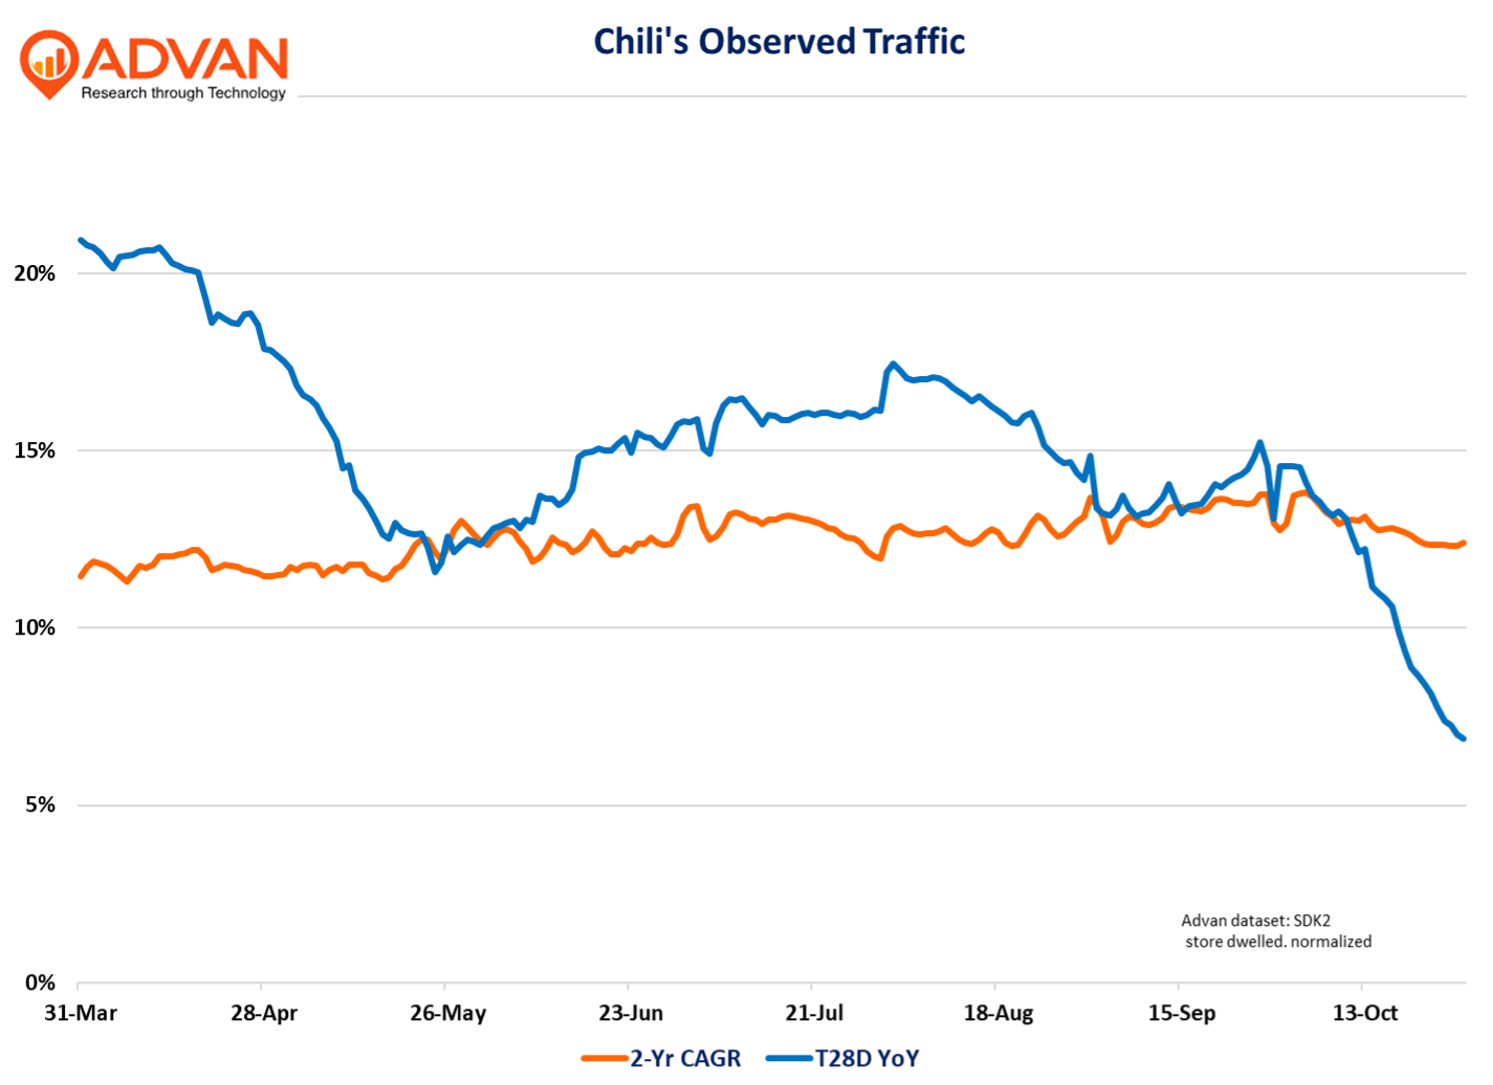
On the consumer, CEO Kevin Hochman said, “Given what everyone is seeing in the industry right now, I thought it would be helpful to talk a little bit more insight on what we’re seeing at Chili’s with the consumer. I’m going to share what we are seeing with the consumer household income levels and some new token data on Chili’s guest behavior. Chili’s continues to grow sales across all households of all income levels. And while others in the restaurant industry are seeing households with lower income pull back, we are seeing just the opposite. Our customer base is very representative of the U.S. consumer across all income cohorts, but our cohort growing the fastest is actually now households with income under $60,000. It’s clear that the better than fast food campaign we’ve been hammering over the past 2 years has positioned Chili’s as an important value leader in the industry, and we are gaining market share with low-income households while others are reporting softness with that group.”
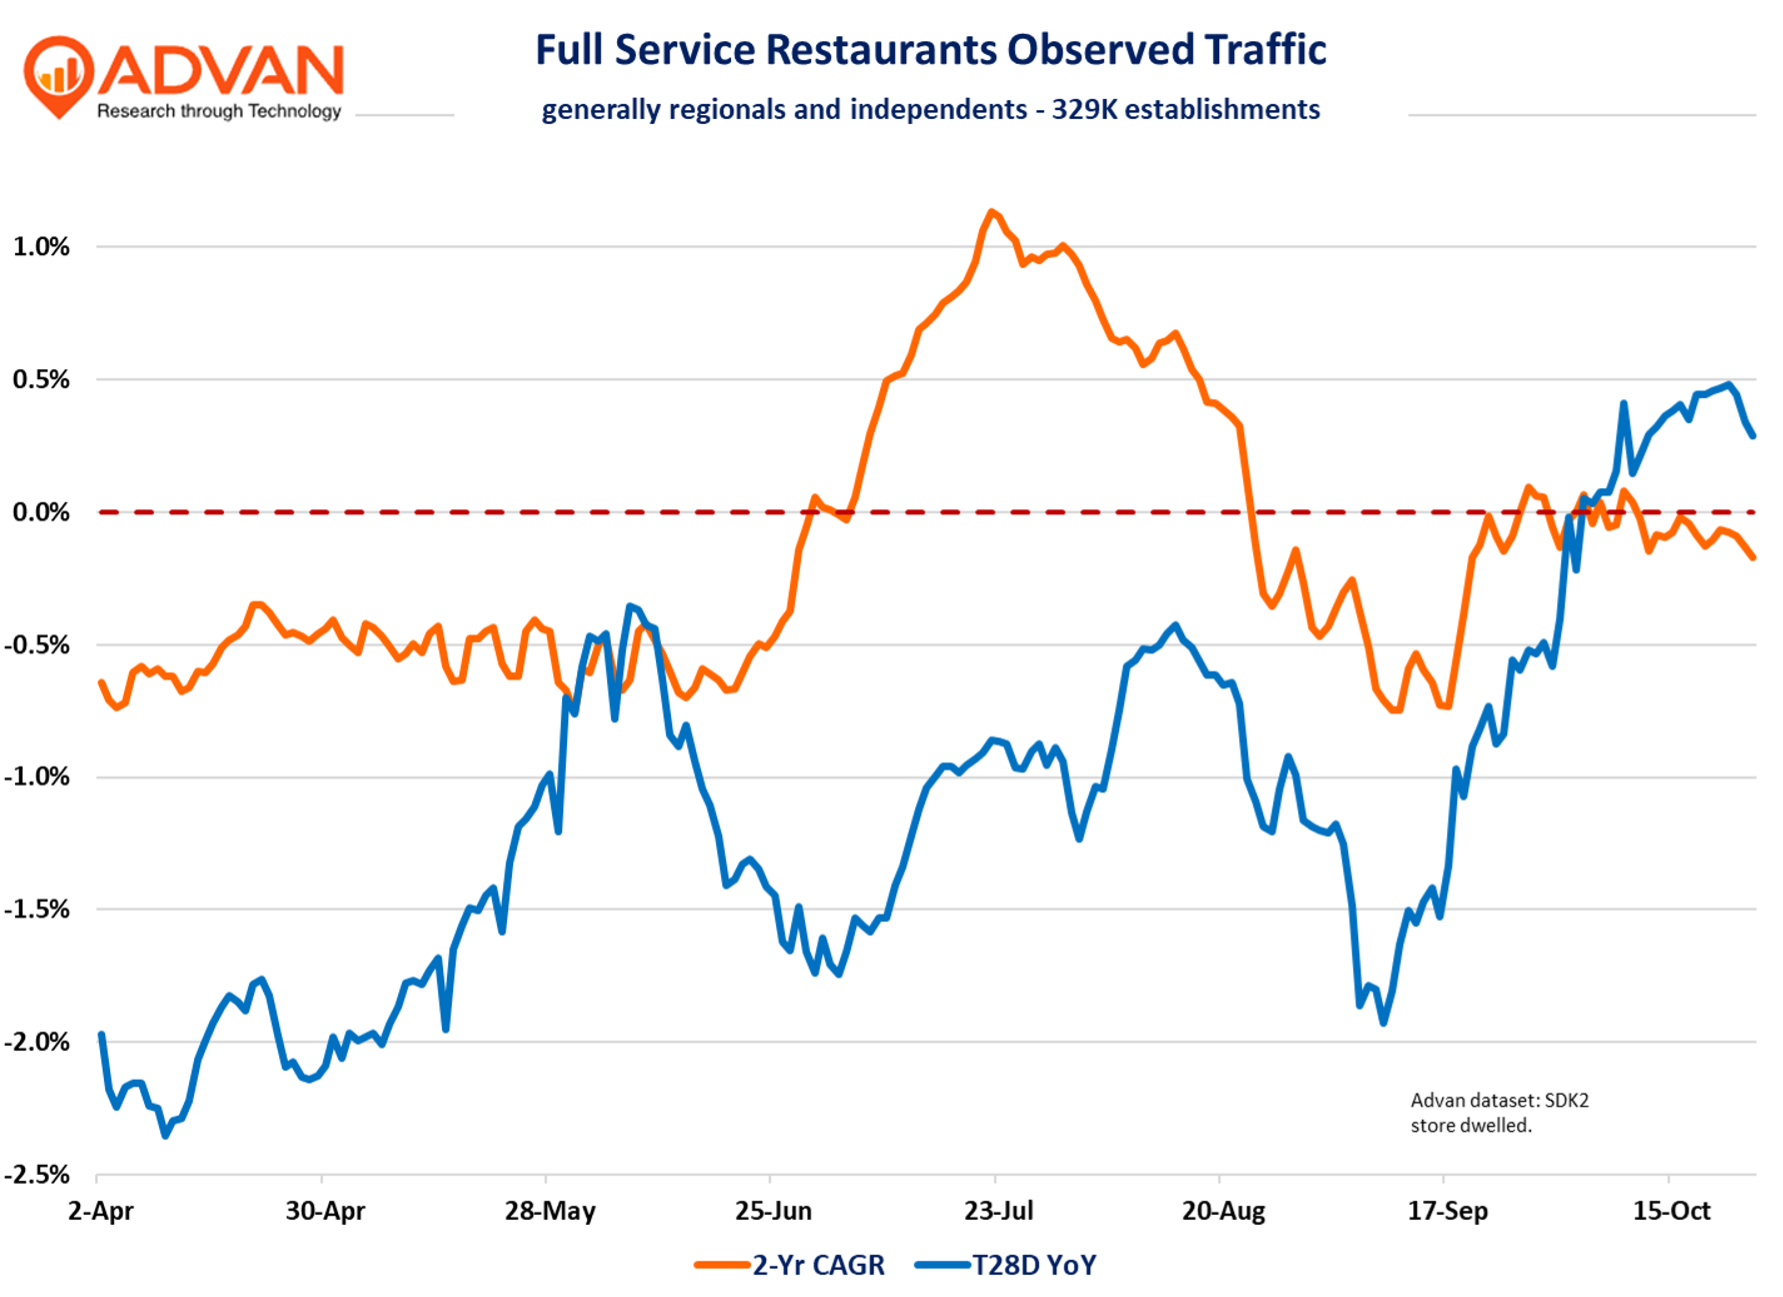
Speaking of full-service restaurants, which we flagged in our September retail sales report as doing better, Sysco confirmed as much with its quarterly earnings, where volumes showed improvement, especially with independents. (Sysco is the leading foodservice distributor in the US and independent restaurants make up 46.1% of volume; a figure that increased +10bps QoQ). We also see that in Advan data, where our index for the industry (NAICS 722511), which is 329K restaurant doors and largely independents, is trending around flat on a 2-year basis vs. –0.5% in Q2. On a 1-year basis, the QoQ improvement was +170bps, and aligned with the improvement in Sysco’s local business. For this segment, “USFS local case” growth, which is the independents, improved +120bps QoQ. Sysco’s trend is shown in their earnings slide included below. (Sysco’s fiscal period ends in June; as such, the Q1 2026 period is July – Sept.)
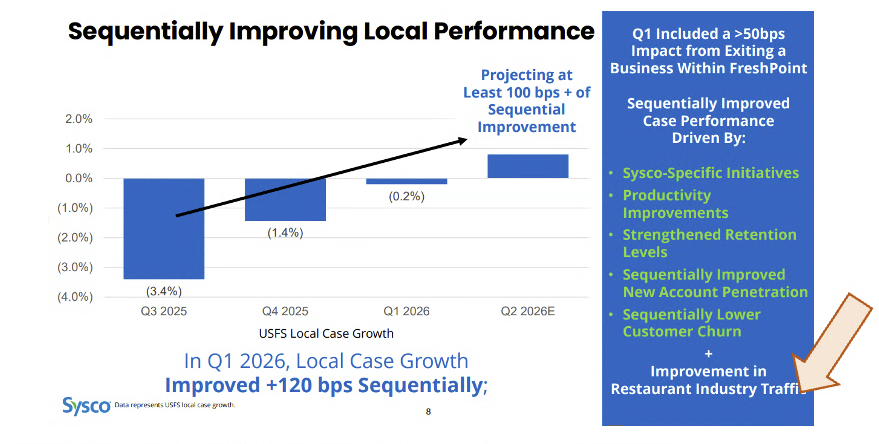
On the earnings call, Sysco CEO Kevin Hourichan said, “In the quarter, our local volumes improved sequentially every month of the period. During the quarter, our rate of local volume improvement was more than two times the overall industry traffic rate of improvement. The positive inflection versus industry traffic was the strongest in September. Once again conveying the progress that we made throughout quarter… Per Black Box restaurant traffic in FQ1 improved by 60 basis points. As a result, Sysco improved more than 2x the overall injury in the quarter. We are pleased that industry traffic improved, and it is even better to see Sysco improving at a faster clip. As I mentioned earlier, September was the strongest month of the quarter for Sysco and the strongest month of positive variance versus the industry. Importantly, Sysco has continued to make progress in October. Given the strong start to FQ2, we anticipate that we will improve our total US local by at least an additional 100 basis points in FQ2 versus FQ1, continuing our positive momentum.”
On industry “weakness,” Hourichan said, “It’s QSR and larger national chains that are underperforming relative to the overall book of business. Independents, this is a good thing for foodservice distributor, independents are performing better. Whether or not that is a secular trend and if that’s something that’s going to be long – continued into the future, it remains to be seen. But at the present moment, independents are performing better than large national chains, and particularly better than QSR.”