 LOGIN
LOGIN

As was anticipated by Advan’s data, Costco reported another strong comp-store sales increase for May (+5.5%), but at a touch lower rate than the March / April trend of +7.2% / +8.6% (adjusted) which benefited from pull-forward on large ticket items which consumer purchased to get in front of prices increases resulting from tariffs. General merchandise comp sales, which is where the pull-forward happened, went from +10% in March / April to around +5%. Based on Advan’s data, we anticipate that the Census Bureau’s retail sales report for May will also show a broader slowdown for the retail industry (a June 17th release). Importantly, we don’t think this slowdown on spending on goods reflects a material deterioration in consumer spending; the lower rate reflects the air pocket behind the pull-forward and consumer pivoting to spending more on travel, leisure, and entertainment, after pulling back recently on these categories as they reflected on the trade and economy during a volatile time. (We learned of the improvement in travel, leisure, and entertainment from management’s comments at investor conferences this week and last.)
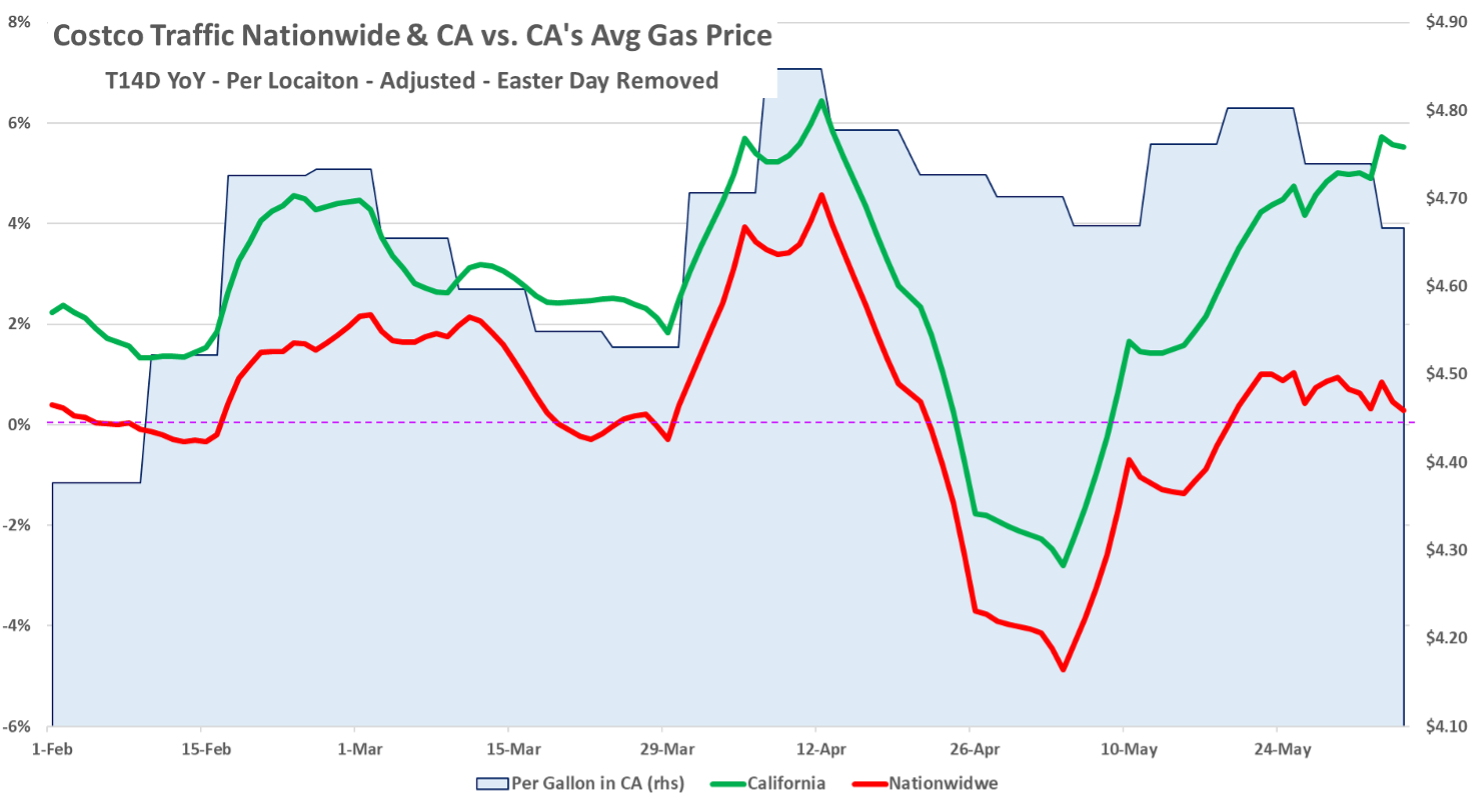
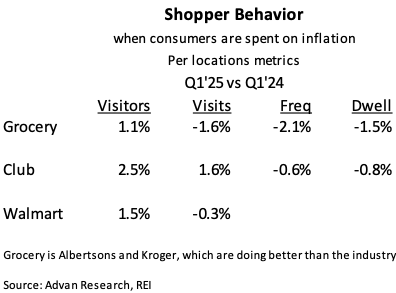
Costco also shared that California was one of the stronger regions during May (along with the Midwest and Northeast), and we also see this in Advan data. As shown above, part of that strength came mid-month when gas prices moved higher in the state. Higher prices motivate members to drive to the club to fill up more cheaply. As a reminder, when gas prices rise, Costco marks up prices slower than competitors knowing that its better relative value drives members to their stations and into the clubs. As is shown, traffic is highly aligned with gas prices; also, as a reminder, California’s gas prices are much higher than the national average, making this a powerful lever for Costco to pull. Lastly, California is a weightier state than most other retailers given how developed the market is for Costco. There are 143 clubs in the state out of 623 in the nation; the state’s locations also produce higher sales than average with traffic per location 20% higher than the nationwide average. As such, the trends in California are generally noticeable in Costco’s total US business. Back to May’s results, we were again struck by the large gains in food & sundries (mid- to high-single-digits) and fresh (high-single-digits). There are two principal drivers to these outstanding gains: the first is the grocery industry’s growth is being driven by private label and fresh and the retailers that excel at it, like Costco, and a frequent topic of ours . Households of all income levels are burnt out by the compounding inflation of ’22-‘24, and as such, they are seeking better value. As such, they are seeking out the value at Costco, clipping coupons, and circling through retailers to cherry-pick promotions. We show what that looks like in the table below. For the biggest grocers, visits, frequency, and dwell are all down, with dwell indicating fewer items in the basket. Visitors are up, because there are more households shopping for deals. However, they come less frequently and they spend less per visit. By contrast, the club channel is able to better hold frequency and dwell time, while also driving more members and visits per club. As a reminder, Costco’s Executive Members drive the majority of its sales (over 73%). For its latest quarter, Executive Members per club hit 41,500, growing at a +5.5% YoY rate, and spend per member increased at a +4.4% rate on a constant-currency basis. For the year, these members will spend over $7,300 at Costco. Wow!
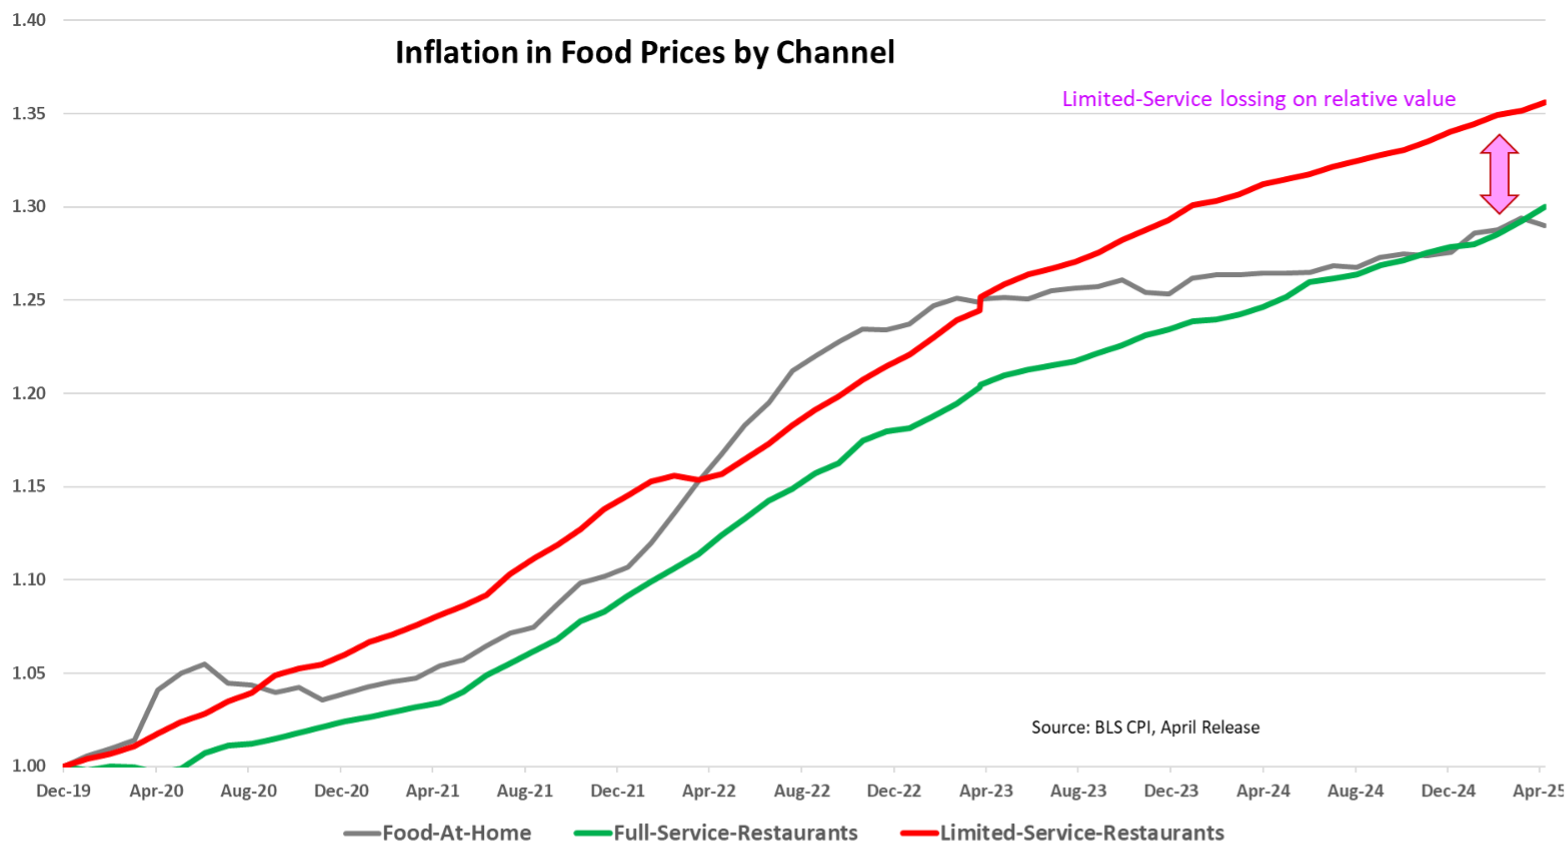
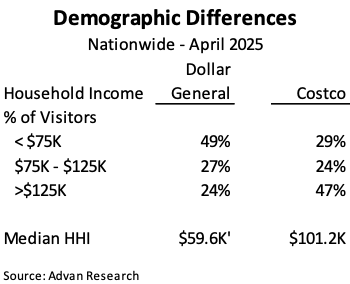
The second factor behind Costco’s outsized growth is share-of-stomach moving from fast food restaurants to at-home (i.e. grocery, mass, dollar, etc) as households seek to save money. Fast food as a the category has taken too much pricing relative to at-home, which we show in the chart below. We wrote about this in our story on Dollar General’s fiscal Q1 results. There, visits for Dollar General customers to leading fast food brands are down high-single-digits YoY for March and April, led by deeper declines for Papa John’s and Domino’s. Costco is on the other side of the income spectrum from Dollar General (see second figure), and visits for Costco customers to leading fast food are down mid-singles for March / April.