 LOGIN
LOGIN")

- Walmart again reported strong results for Walmart US and Sam’s Club, with the business model rapidly changing with fast delivery / upgraded merchandise offerings attracting more affluent households and that / retail evolution producing a large profit pool of alternative revenue streams (advertising, etc.) that allows Walmart to lean into EDLP, e and drive more separation from incumbent retail.
- FQ4 contained a lot of external noise, hurricane comps, government shutdown, a more choiceful lower-end consumer, and yet, Walmart delivered +4.6% US comps, which keeps the 2- and 3-year comp CAGRS largely as they were.
- Walmart is especially gaining market share in grocery, as is Club and Amazon. The three are particularly gaining share of the panty load – a now material headwind to CPG.
- Management didn’t indicate any degradation in aggregate US consumer spending; however, they will have certainly notice that the K-shape is becoming more pronounced, and that’s certainly embedded in their 2026 guidance.
As was broadly expected, Walmart reported excellent FQ4 top-line growth for the US, as did Sam’s Club. Walmart US comp-sales of +4.6% can be disaggregated into +5.2% from its “New Businesses” (marketplace, store-delivery, curbside, 3P advertising, and membership fees) and +1.2% from Health & Wellness sales (GLP-1s). Grocery (+MSD) and general merchandise (+LSD) outperformed their benchmarks. Advan shows* traffic +4.4%** and average ticket +0.5%, and an increase in visit frequency. The more modest increase in average ticket (+0.5%), relative to the reported comp-ticket (+2.0%), reflects GLP-1’s (frequently 3P paid vs. 1P). The +0.5% observed figure and the increase in visit frequency reflects consumers’ shopping deals and the paycheck cycle. CEO John Furner (the new sheriff) said, “Again, this quarter, the majority of our share gains came from households making more than $100,000. For households earning below $50,000, we continue to see that wallets are stretched. And in some cases, people are managing spending paycheck to paycheck.”
Per New Businesses’ +5.2%, the absolute level of growth was +29%, ahead of Advan’s transaction data (+20.4%) due to faster growth in advertising (+50%) and membership fees (+double-digits%). Of note, the combination of advertising income and membership fees represents nearly 1/3 of operating income, and when including marketplace revenue, the figure is in the high-30s. This large pool of fast growing revenue allows Walmart a lot of flexibility to be tight on price; a large competitive / business model challenge facing Target, Albertsons, and others.
Back to the +20% increase per Advan, that reflects Walmart’ gains in more affluent households (the ones that are willing to pay for the convenience of delivery). Advan shows that the increase is largely transaction. This “channel figure” debits the inside-the-store metric, but since store delivery (+50%) utilizes the store, we credit it back to the store. As such, on an underlying basis, and centered on the store, the comp-sales increase excluding RX was up, driven by traffic (again shopping for deals and the paycheck cycle). Relatedly, overall general merchandise “units” were down on a comp-basis as strong demand by affluent households, was more than offset by a pullback by less affluent households (see our Q3 note ). Demonstrating the “affluent bump,” in marketplace, the categories fashion, cook, dining, and home décor increased >40%. But that leaves general merchandise sales inside-the-store at down. Yes, the K-shaped economy is well represented in Walmart’s results. It also suggests that expectations should be moderated for the results by the dollar stores.
Per the +MSD comp increase in grocery – that’s largely more units, with outperformance by Walmart’s house brands. Walmart outperformed the at-home** category (+3.3%), especially in units as at-home inflation was +2.0% vs Walmart’s +0.6%. Walmart is winning market share given its EDLP value brand positioning / promise – a promise reinforced in consumers’ mind given that its: pricing adjustments are lagging inflation at retail, investments behind its house brands, and strong advertising campaigns (especially over the holiday ).
Loyal readers will recall that we’ve been writing that the grocery category’s growth would be driven by private label and the brands that excel at it since 2023 (latest here ); that’s what Walmart is leaning into. Obviously, that creates volume pressure on national brands (in Wall Street parlance called “Big Food”); just this week’s CAGNY conference, General Mills lowered its annual guidance (again). For General Mills, profit for the year is now expected to decline -20%. At the conference, General Mills and other Big Food brands noted that consumers continue to shop on promotion (leading to more retail traffic, but lower basket sizes) and channel mix pressure (more shopping happening at Club, mass, and Amazon), which given these retailers’ large scale and buying powers, leads to lower realized pricing for the CPG brands. (Here ).
Per GLP-1s (another frequent topic of ours), to Walmart and other retailers with a pharmacy business, GLP-1 could be less of a driver to sales in 2026 given the category’s significant price declines. However, those declines will drive faster unit growth, as will the pill format, and the significant increase in category advertising (see the Super Bowl). As such, the absolute volume growth should be a 1.5-2X increase from 2025’s level. That’s both a headwind and tailwind to food retail (both grocers and limited-service restaurants). For Walmart, it can lean into its offerings in produce, high-protein merchandise, and connectedness with consumers to offer compelling solutions to the evolving consumer need. (Successful execution remains to be proven.) Additionally, that connectedness and a portfolio of produce give Walmart (and retail) more tools to meet the changing needs than Big Food. (Listen to General Mills presentation at CAGNY – seems like a spot between a rock and a hard place.)
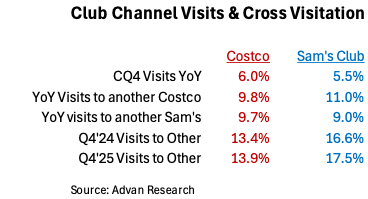
OK, back to Walmart Inc’s results and guidance, Sam’s US comps of +4.0% can be disaggregated into +3.8% from New Businesses and +0.2% from inside-the-store, with average ticket (-1.3%) and transactions higher. The New Businesses grew +23% and now represent a stunning 19% of revenue. Grocery (+MSD) and general merchandise (+MSD+) reflect a strong holiday season, but at a cost to margin. Underlying gross margin contracted -37bps, which is a very large decline in the Club business, and it is reflective of Sam’s investments to win Club channel households. As shown in the table below, the growth in visitation between Sam’s and Costco is high with cross-shop from Sam’s to Costco rising faster than Costco to Sam’s. It’s hard to know if this is wins by Sam’s of Costco members, or the other way around. However, it does show that there are a large number of households that shop both Sam’s and Costco. Game On! Spend per member is a good indication to which way the wallet share is flowing.
In terms of guidance, management didn’t indicate any degradation in aggregate US consumer spending; however, they will have certainly notice that the K-shape is becoming more pronounced, and that’s certainly embedded in their 2026 guidance for net sales growth of +3.5-4.5% (inclusive of a -100bps headwind from legislated pharmacy prices) and operating income growth of +6.0-8.0%. Given Walmart’s large size, underlying top-line growth of +4.5-5.5% is quite robust and likely ahead of the growth in overall consumer spending. See our last write-up on industry trends here , and Walmart and Sam’ s. ‘* We use “shows” and “observed” interchangeably. ** The +4.4% increase is far above the reported +2.6%, which excluding store delivery, is up +0.5-0.9%. Additionally, our traffic figure accelerated by +400bps QoQ, but the reported figure only accelerated +80bps. Typically, our figures are very close to Walmart’s reported figures. And so, why the large mismatch between the reported / underlying figures and our observed figure? In our opinion there are four (not mutually exclusive) potential reasons. One is the hurricane comparisons, dynamics around the government shutdown, and the break in SNAP. Two is that the stock-up / deal shopping / paycheck cycle has become more pronounced (something that Big Food alluded to at CAGNY). Three, John Furner said, “It’s pretty typical that you’d see in the holiday time frame people leaning on delivery more. We had really great experiences and great results in November with Thanksgiving. More and more customers chose to have their Thanksgiving meal delivered.” And so, a potential reason for the mismatch is that more customers are coming into the store to create their lists, but then they shop digitally and have the order delivered vs. packing it into the shopping cart, then into the car, and then into the home. Said differently, maybe there is a larger shopping behavioral change. Walmart’s results over the past three years certainly suggest that they have smartly latched onto that change. And four, our normalizations have become disturbed, and we need to re-look at the data. (We are.) *** BEA PCE , through November.