 LOGIN
LOGINTarget (NYCE: TGT) announced today that it expects lower profit due to high inventory.
It is counter-intuitive, but cellphone location data is measuring this discrepancy by monitoring Target’s supply and demand sides.
On the demand side, in the image below we can see foot traffic in Target stores () and its associated blue trendline being relatively steady, at a 3% Y/Y increase vs same quarter last year, and closely following the revenue y/y change; on the supply side however we see that employees in Target distribution facilities () are up 48% on a Y/Y basis for the last quarter, and this over-supply has persisted for the last 3 fiscal quarters.
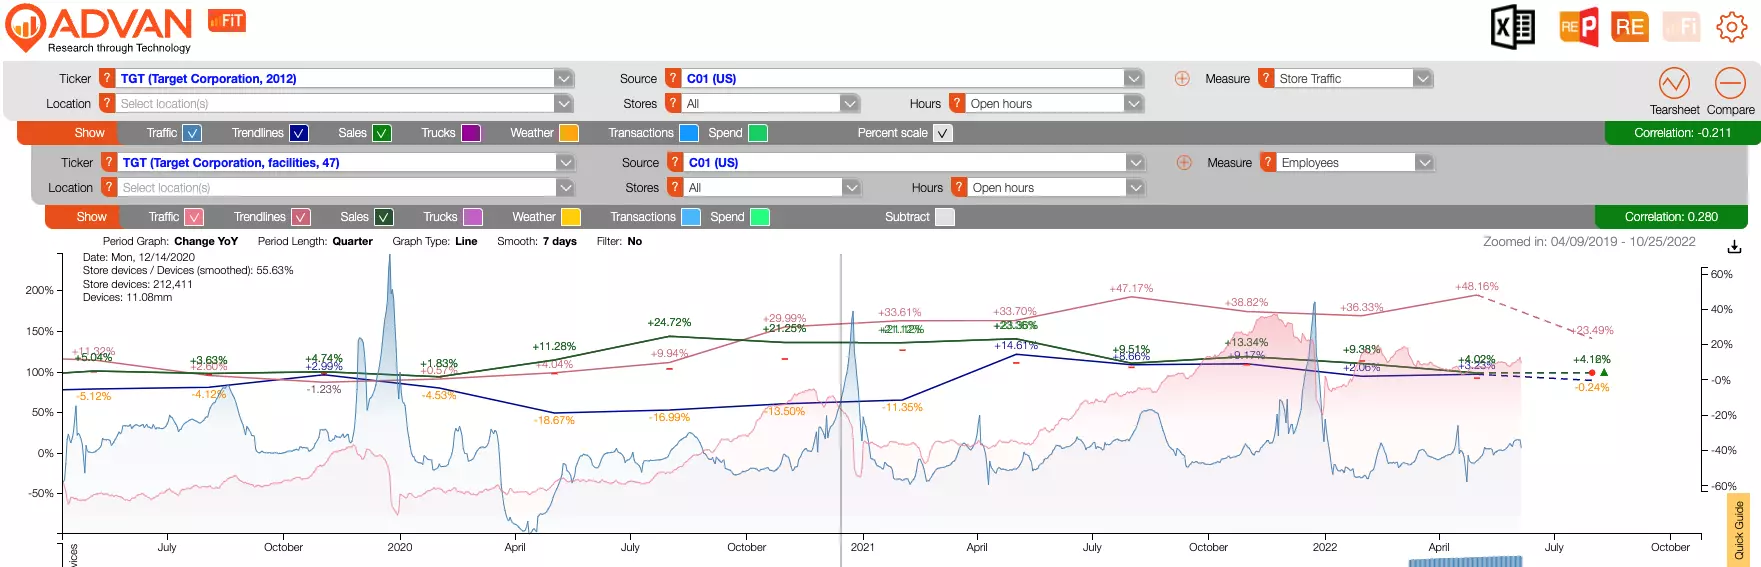
This imbalance of supply and demand is causing the supply glut and associated price pressures for Target. We can see that the company is trying to reverse that trend in the current quarter, but judging from today’s announcement that change probably arrived a bit too late.
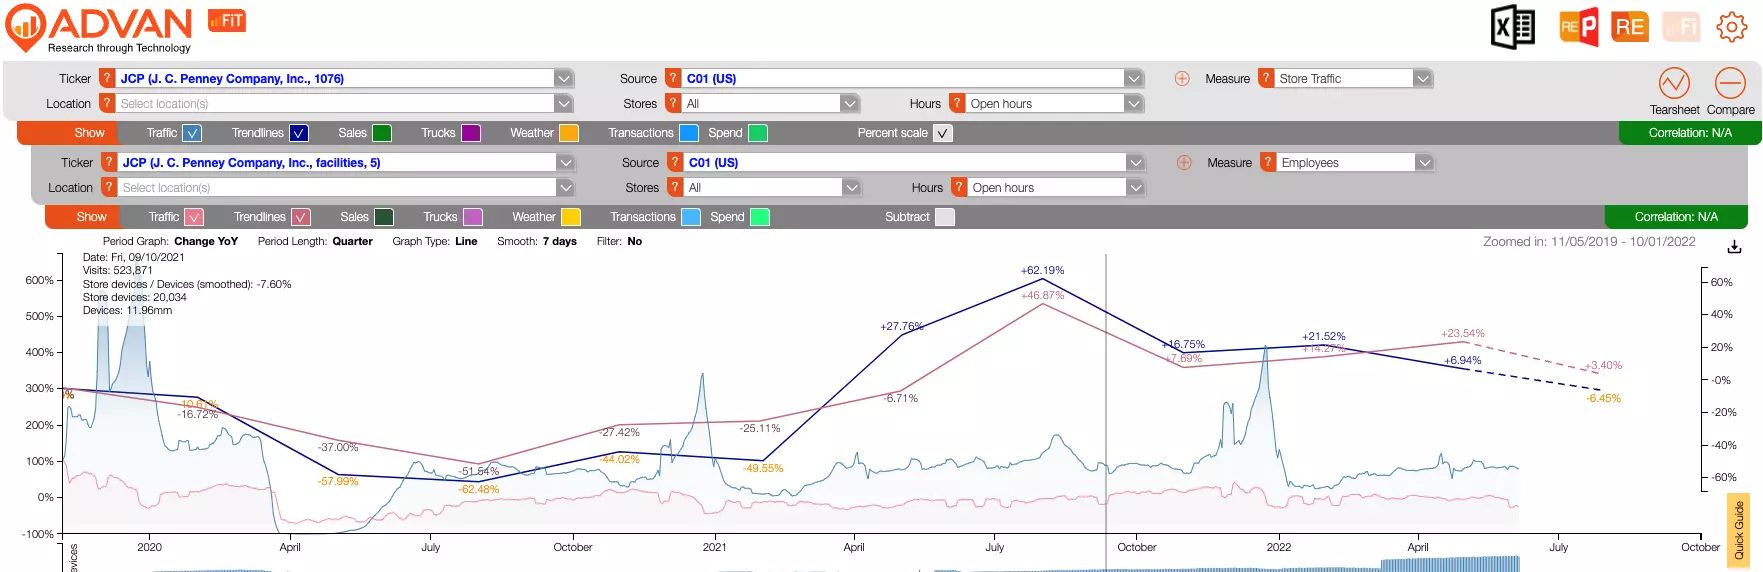
This sort of imbalance is not the same across all companies. For example, in the picture below JC Penney shows a much more balanced picture, with their supply in line with demand:
At Advan we measure the demand side (foot traffic at companies’ stores) for over 3,000 companies, and the supply side (production) for over 1,000 companies; for over 100 companies we measure both the supply and demand, so the above imbalances can be spotted ahead of time by investors.