Akron Foot Traffic
This shows the citywide foot traffic in Akron for the last few years.
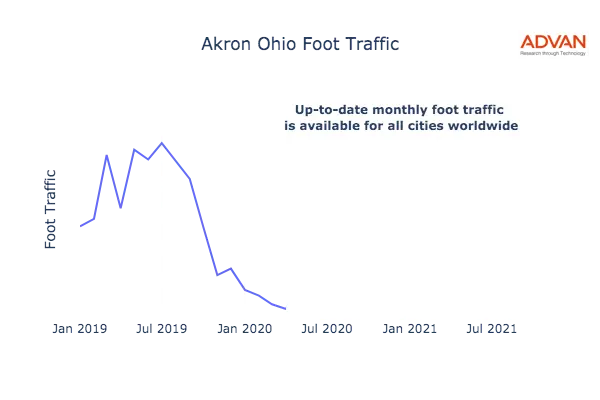
Up-to-date monthly foot traffic is available for all cities worldwide.
Akron Work From Home Trend
This chart shows the number of people that are working from home, using mobility data to determine their home and work location. The trend in most places has been that more people are working from home during the pandemic.
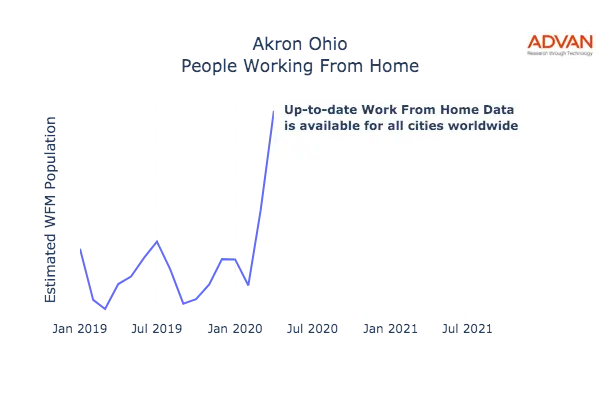
Up-to-date Work From Home Data is available for all cities worldwide.
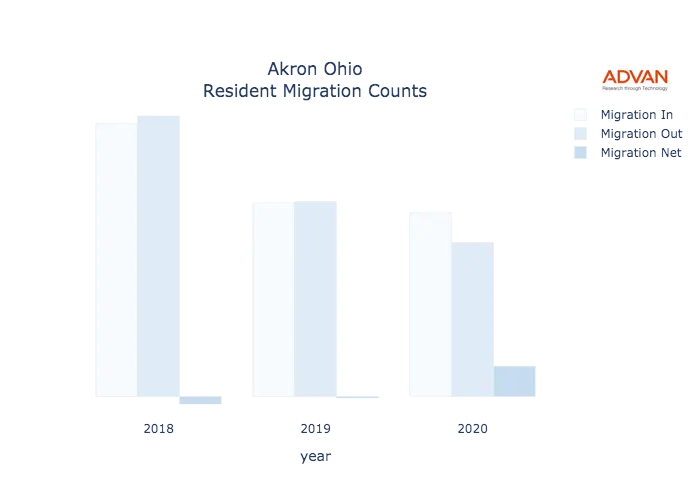
The charts below graph the inbound, outbound and net migration to the city of Akron Ohio for each year of
data available. Data displayed on the charts is annually aggregated; the REPerspectives product
allows analysis of mobility trends with monthly granularity by State, Zip, County and Census Block Group.
Additional reports
are available for the city residents, employees and tourists.
Akron Ohio Migration In
The map below shows the migration into Akron by Census Block Group (CBG).
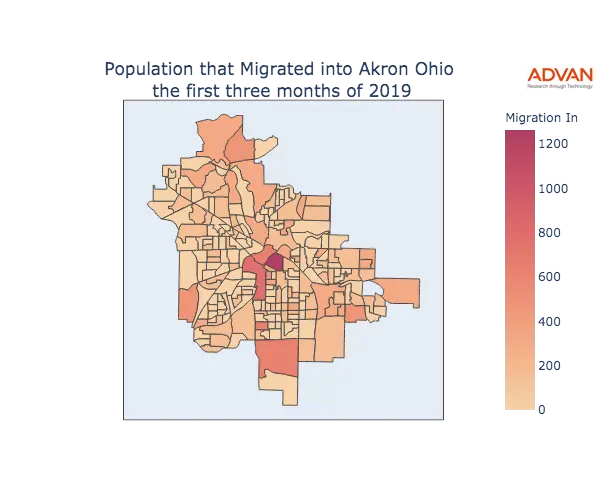
Up-to-date Migration is available for all cities worldwide
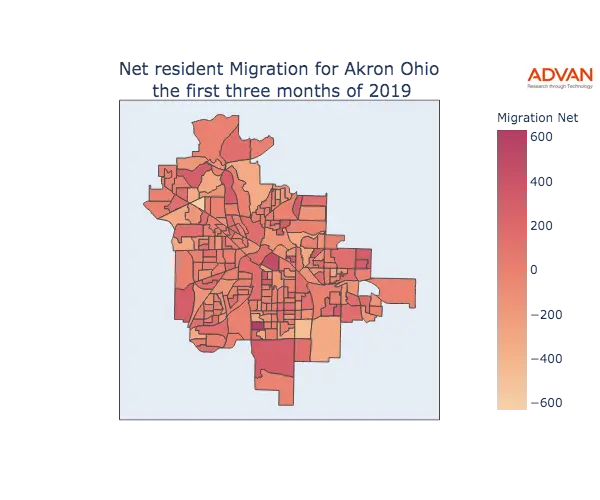
Akron Ohio Net Migration
Akron saw a net negative (outbound) resident count flow. There were 320 residents moved out of the state.
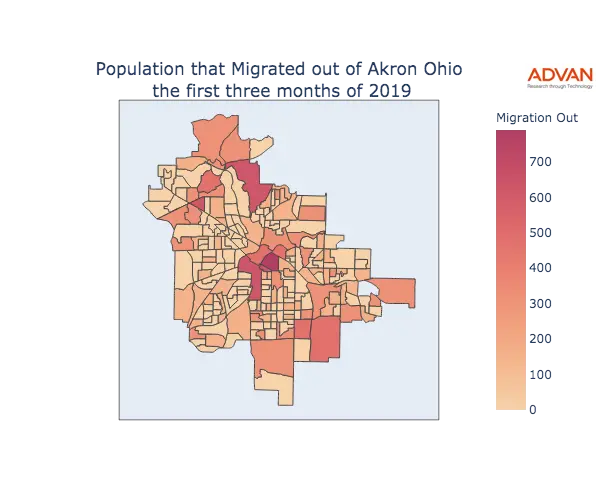
Akron Ohio Migration Out
People migrating out from Akron color coded by Census Block Group (CBG).
Akron Ohio Residential Migration Counts
This chart shows the number of residents that moved to Akron.
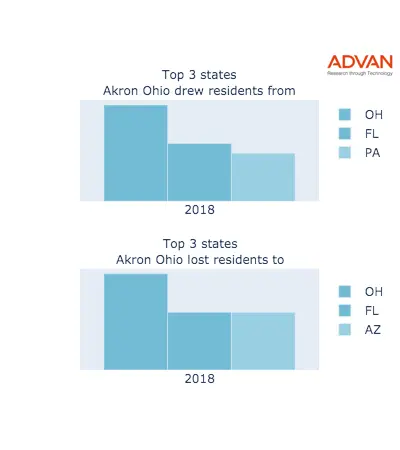
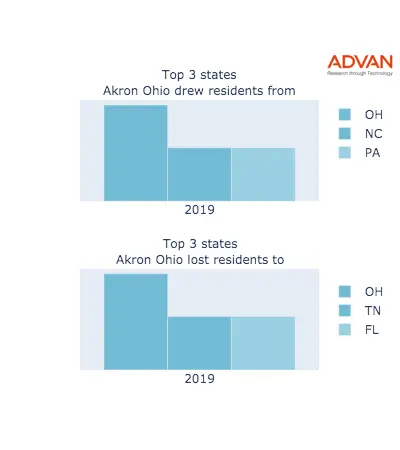
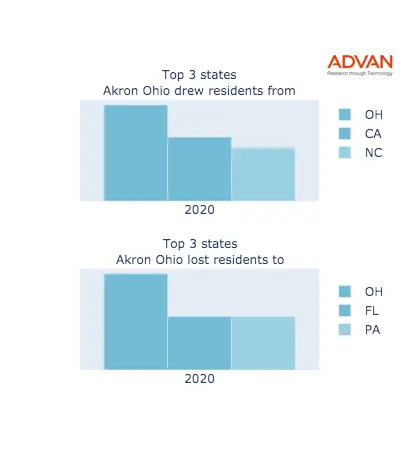
States migrated to and from
The state that most migrants moved from (origin state, excluding Ohio itself) to Akron Ohio was Florida. The state that most migrants moved out (destination state, excluding Ohio itself) from Akron Ohio was California.
ADVAN measures the inbound, outbound and net migration to the city of Akron Ohio for the years 2015, 2016, 2017, 2018, 2019, 2020, 2021, 2022 and 2023. Data displayed on the charts above are annually aggregated but using our product REPerspectives, it can be analyzed with monthly granularity by State, Zip, County and Census Block Group. Additional reports are available for the city residents, employees and tourists.