Advan Research computes accurate daily foot-traffic for all the properties and loans of the QCMT 2013-QCA deal. Here is the foot-traffic aggregated across all the properties of the deal:
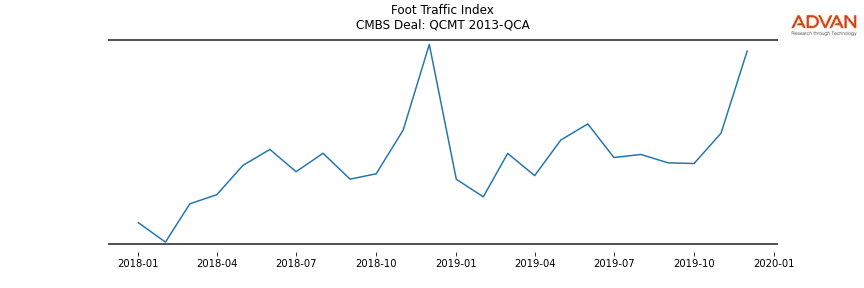
Monthly and daily data is available on a T-1 basis (i.e., up until yesterday).
The chart below shows the percentage of foot-traffic for the largest loan, Queens Center Mall.
The foot-traffic for the top 3 most visited locations within the deal is shown below. Ranking of the properties using other fields, such as by square footage or number of employees, is also available.
The most visited properties in the deal are:
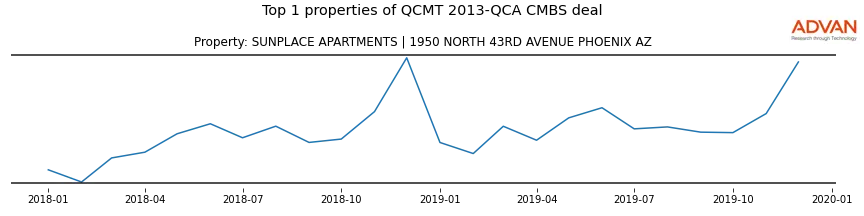
Monthly and daily property and loan data is available on a T-1 basis (i.e., up until yesterday).