By Thomas Paulson, Head of Market Insights
In the context of a market that grew by +3.2% in value and +2.1% in volume, Advan took a look at Publix’s and General Mills’ Q4 results, along with two smaller regional grocers in California – Smart & Final and Stater Bros, brands that we shop and that have been in the news. The results and data from all four reinforce one of our 2025 themes: the year is going to be a difficult one for the industry with (1) consumers increasing their loyalty to retailers that have a strong private label and produce offerings and (2) increased promotions to retain customers by those grocers on the losing side, with those promos being concentrated on the national CPG brands. Successful merchandise differentiation is also a determiner as we have written in our analyses of Sprouts. Given these dynamics, we are closely watching retailer basket size and merchandise margin as an indicator of durable connections with its shoppers and its ability to steadily grow profits; by contrast, we are less persuaded by management comments that they are growing loyal households just because they have more mobile app users. As a means to stretch their dollars, consumers are using multiple retailer apps to cherry-pick deals and promotions, i.e. the number of app users is vastly outgrowing household growth. That yields increased traffic and transactions, but fewer items in the basket and an erosion in basket margin and unit economics.
Let’s start with General Mills as it is on the losing side of the above construct. For the 13-week period ending February 23rd, North American Retail Sales fell by -7% due to a -6% volume decline and a -1% price decline. Those declines led to a meaningful decline in gross margin and a -14% decline in profits. During this period, market* volume growth was +2.1%; as such, the difference between Mills’ -6% volume decline and consumption up +2.1%, or 810bps, is lost share-of-stomach with most of that to the categories noted in the above paragraph. Management called out cereal and snacks as particularly weak. We’d note that: (1) Mills has low exposure to protein (which is winning share-of-stomach) and (2) the competitive intensity of the snacks category (~10% of the business) has meaningfully stepped up. Management also cited retailer inventory reductions as a headwind to growth which speaks to those retailers’ own financial pressures, particularly grocery retailer brands losing market share to Aldi, Costco, Sam’s, Trader Joe’s, Sprouts, and the like (i.e. those with a strong and differentiated private brand business).
The decline in North American price realization (-1%) aligns with the second point of our theme discussed above. With results, Mills lowered its guidance with the current quarter’s profits expected to decline substantially (-20%-ish), with a large part of that due to “improving value for consumers by offering a broader array of pack sizes, reducing price gaps, and more,” per CEO Jeff Harmening. And “We expect increased commercial investments will be a 13-point headwind to operating profit in Q4. This includes investments in trade promotion, a double-digit increase in media expense, and early investments to support significant new product launches,” per CFO Kofi Bruce.

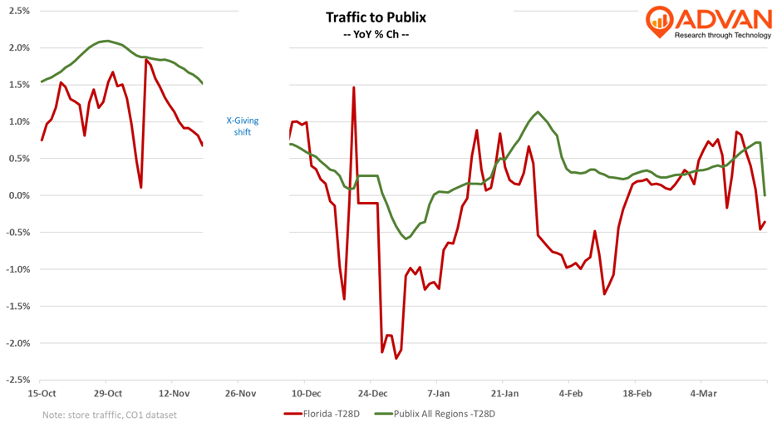
For calendar Q4, Publix reported a +4.1% increase in comp-sales and a +4.8% increase in profits. However, the quarter, like the prior, was noisy due to the hurricanes. If we adjust for the storms and inflation, the sales increase was around +2.7%. Advan estimates that comp-traffic increased +1.0%, which would put the comp-ticket at +1.7% and that’s likely from the sale of high-priced GLP-1 perscriptions and some inflation. (Advan’s data shows average ticket increasing +1.1%, or roughly aligned.) Excluding inflation, basket size or units-per-transaction (UPTs) would be up slightly. For Q3, Advan estimates that comp-traffic increased +2.3% in Q3 and a slight increase in UPTs. And so, both traffic and UPTs were healthy for Q4 and roughly at the same level as Q3 when adjusting for the the storms and the shortened holiday period.
Looking forward and as shown in the chart above, Q1 has been noisy, especially in Publix’s largest market, Florida. Adjusted for Leap Year, traffic for the quarter is running up slightly (+0.5%) and average ticket has increased +1.2%. The increase in ticket likely reflects higher egg prices and GLP-1 sales. If one adjusts for inflation (CPI is +2.0%) and GLPs, that would point to a decrease in UPTs of around -2%. If these trends were to persist for the remainder of the quarter then that would indicate a deterioration from Q4’s results. That, in turn, would likely yield a decrease in profits and a bit of a reset from 2024’s level, i.e some squeeze.

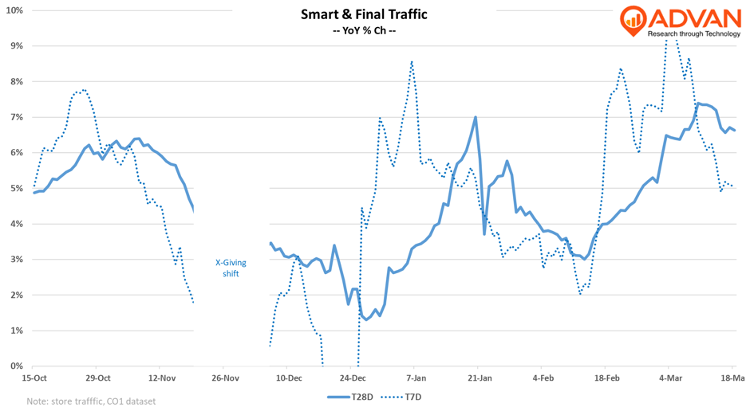
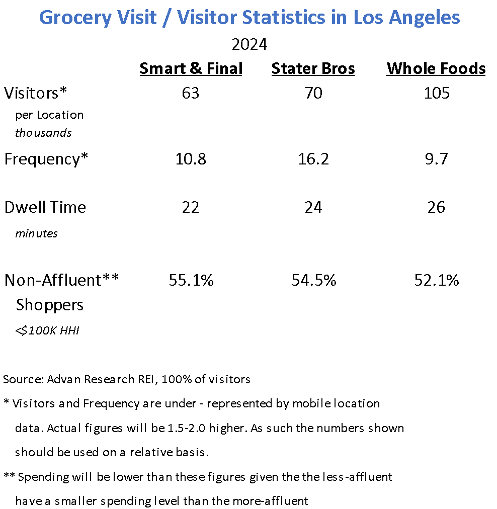
Turning to Smart & Final and Stater Bros., Advan shows Q4 traffic for Smart & Final’s 255 locations increasing by +4.0% but average transaction value declined -4.9%. As a customer, we aren’t surprised by the trend. Smart & Final has been heavily promoting its private label offering in the store, circular, and mobile app. However, the level of decline in average transaction value is surprising. Smart & Final caters to those seeking deep value and the less affluent and so some of its growth in visitors and visits may be by those new to the brand and consumers who will be putting fewer items in the basket and only lower priced items. The table below shows that its frequency of shop is roughly even with Whole Foods, but the dwell time is sufficiently less (-15%). Dwell time is correlated to basket size, both UPTs and average transaction value. For the Los Angeles market in 2024, Smart & Final grew customers, dwell time, and frequency of visit. And so, part of the transaction value decline is due to mix of visit and customer, and not due to an erosion in unit economics. As shown in the chart above, year-to-date visitation has been strong as those customers acquired in 2024 increase their frequency of visit with the brand.

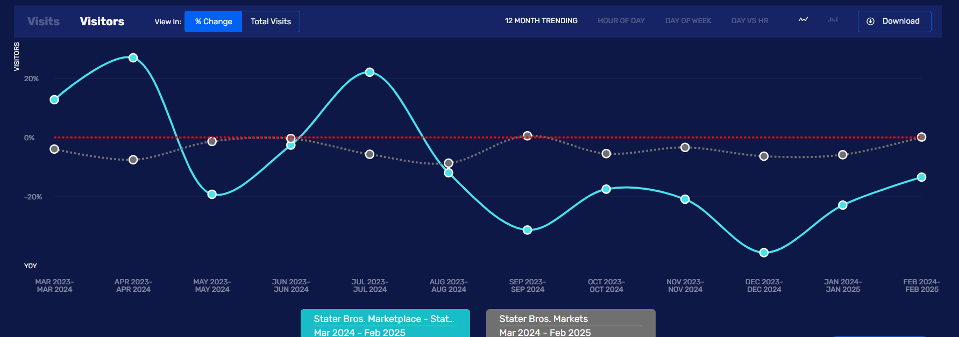
In contrast to Smart & Final’s visitor growth, Stater Bros. has been losing customers, both in Los Angeles overall (as shown in the gray line in the chart below) and at its Westminster location (the turquoise line below). For Los Angeles (100 locations out of 164 total), dwell time and frequency of visits both improved, but that’s due to it retaining its best customers – i.e. a mix dynamic vs. an underlying improvement. Visitors on a trailing-twelve-month basis are down 5% as of December. Separately, average ticket decreased -2.6% in Q4, likely due to fewer UPTs. (Per Advan data, Stater’s average ticket is 15% higher than Smart & Final’s.) In sum, most of Stater’s growth metrics trended in the wrong direction in 2024. Looking at just the Westminster location and the table below on “visits by drive time,” one can see a concerning decline (-5%) in the < 5 minute drive time bucket, which is 41% of total visits, i.e., visits by households that would consider the location to be their “local grocery” are down mid-single-digits. Zooming back out, we see that high-frequency visitation (4 to 12 times in the quarter) for the region is down sharply, i.e. those likely associated with being the “local store.” Lastly, looking at the number of visitors to each of the region’s stores on a trailing-twelve-month basis, 20% of those are down double-digits. And so, in the press about the company’s recent lay-offs, management said inflation was to blame; while inflation has created all sorts of havoc on the industry, both directly and indirectly, it isn’t the sole factor for the decision, Stater is feeling a lot of competitive squeeze on its unit economics.


*BEA PCE, Section 2, February 28, 2025 release.
Thomas has been Head of Market Insights for Advan Research since January 2025. Previously, he served as Director of Research and Business Development at Placer.ai, where he was instrumental in providing actionable insights derived from location analytics and the path for expansion into new verticals. His extensive background also includes two decades as a Wall Street analyst and portfolio manager in asset management at Alliance Bernstein, Cornerstone, and others. Linkedin profile.

